18
from 1994 and onwards. In 1994 the 1934 cohort is affected by a maximum of two
years of potential early retirement while the 1938 and 1939 cohorts have had a
maximum of 5 years of potential early retirement in 1998 and 1999.
consists of real data for the 1993-1999 period but of predicted values for the
1987-1992 period.
displays the raw data of log average number of days
inpatient care at ages 50-54 over the same period. These data forms the base for the
informal test and for the predictions made in the 1987-1992 period.
20
shows a
decreasing trend for both groups of civil servants. Based on regression analysis we
cannot reject that the trends of the two groups are parallel (p-value of different slopes is
slopes is 0.6097).
21
Hence, this informal test provides no support for rejecting parallel
trends in health for the two groups of civil servants after the age of 54, in absence of the
1992 Defense Bill.
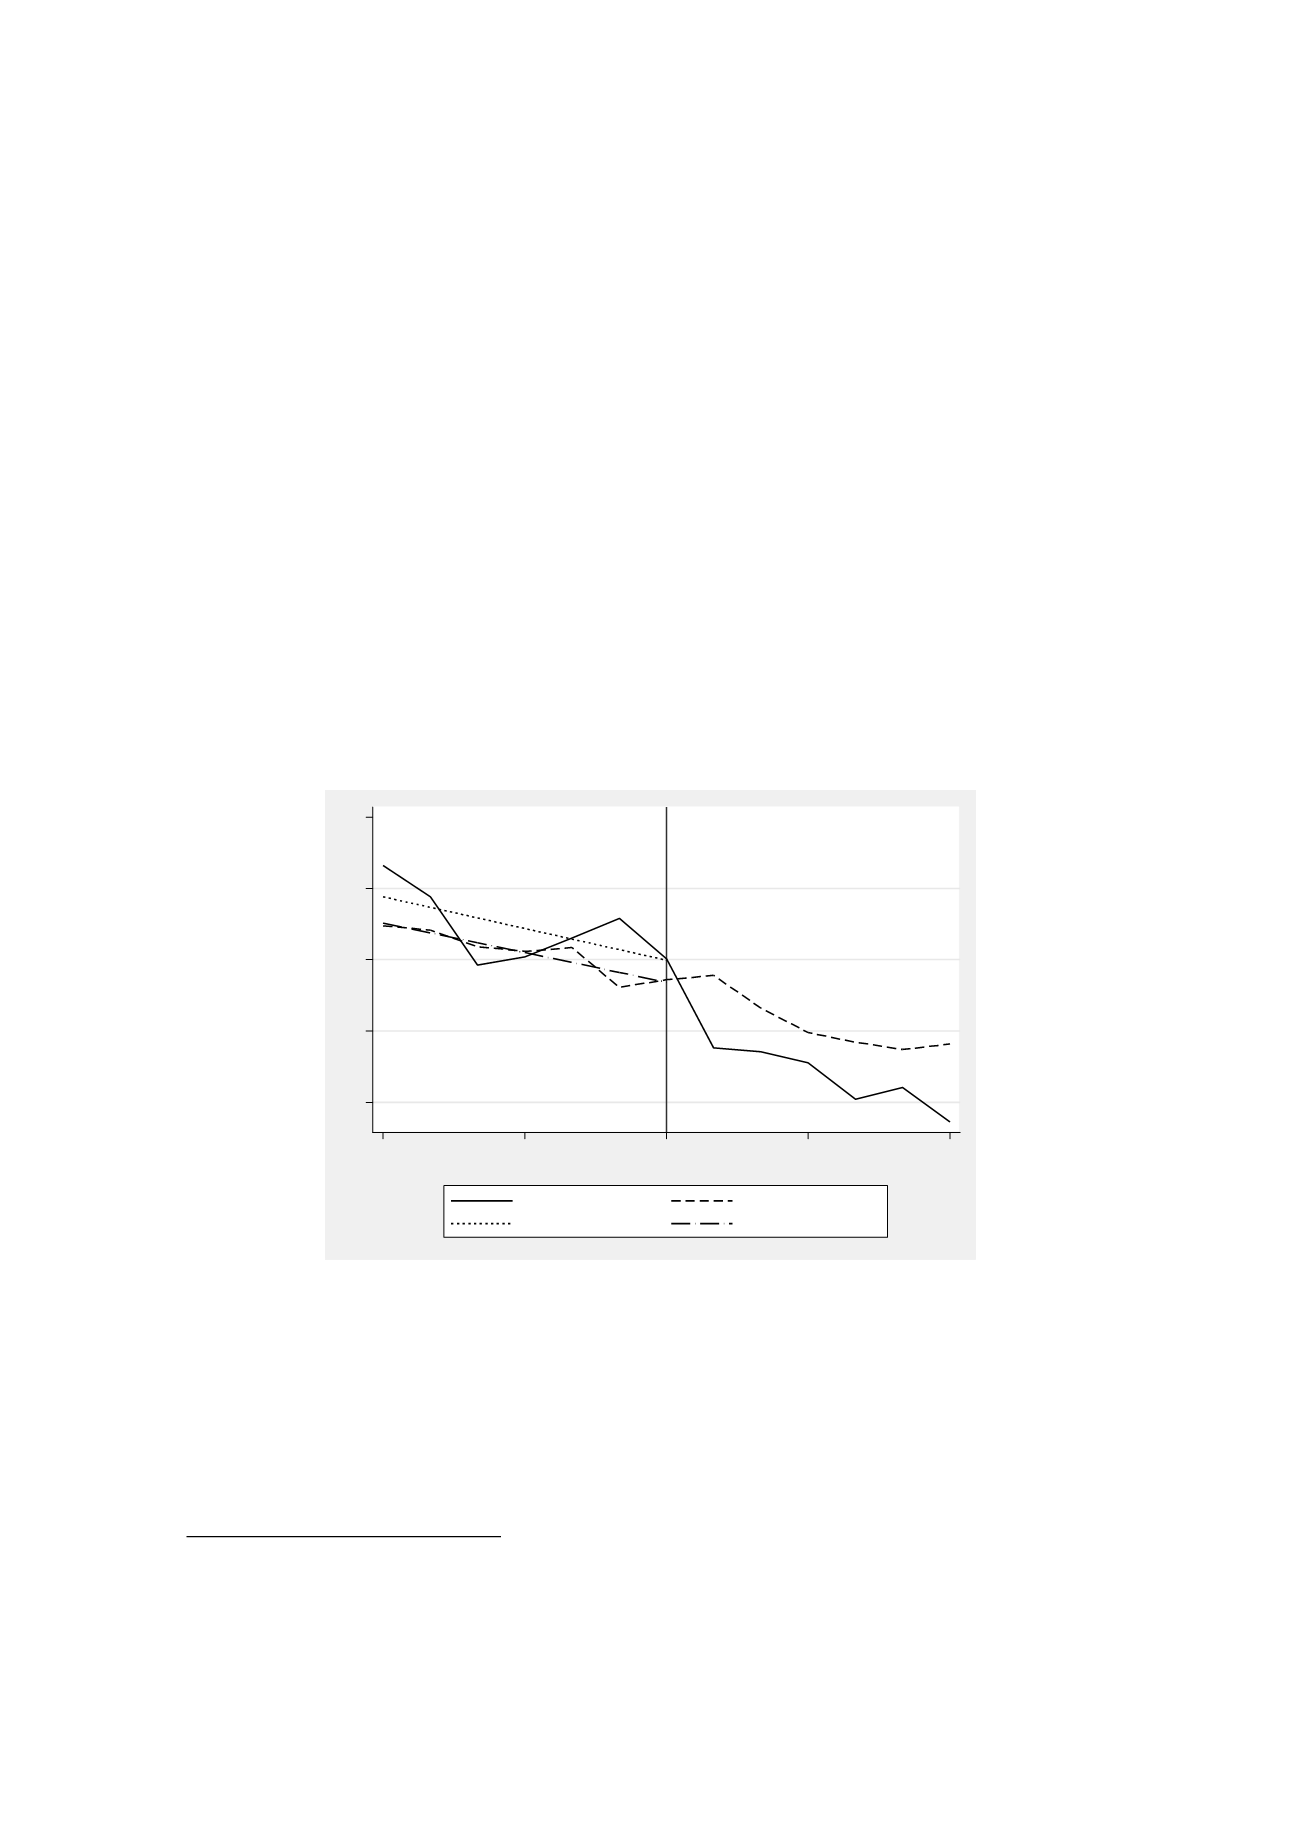
Figure 6
:
Log average days in inpatient care at 56-60 years of age (based on predicted values
for 1987-1992 and real data for 1993-1999) before and after the reform and estimated linear
trends 1987-1993; 1987-1999; the estimated slopes of the trend (before 1993) are -0.0742 and
-0.0694 for military and non-military, respectively
20
To predict days in inpatient care visit at ages 56-60 we multiply days in inpatient care at age 50-54 in 1987 to 1992
with the fraction of inpatient care days at ages 56-60 (cohorts 1931-1932) to that at ages 50-54 (cohorts 1939-1940)
in the period 1991-1992.
21
The p-value for a test of different slopes is 0.5375 for the age group 45-49 years of age. We also estimated second-
order polynomial regressions models and tested for differences in gradients between the two groups, but we could not
reject the null of equal gradient (results are available upon request).
1
1.5
2
2.5
3
1987
1990
1993
1996
1999
year
Military 56-60
Non-military 56-60
Linear prediction
Linear prediction


