15
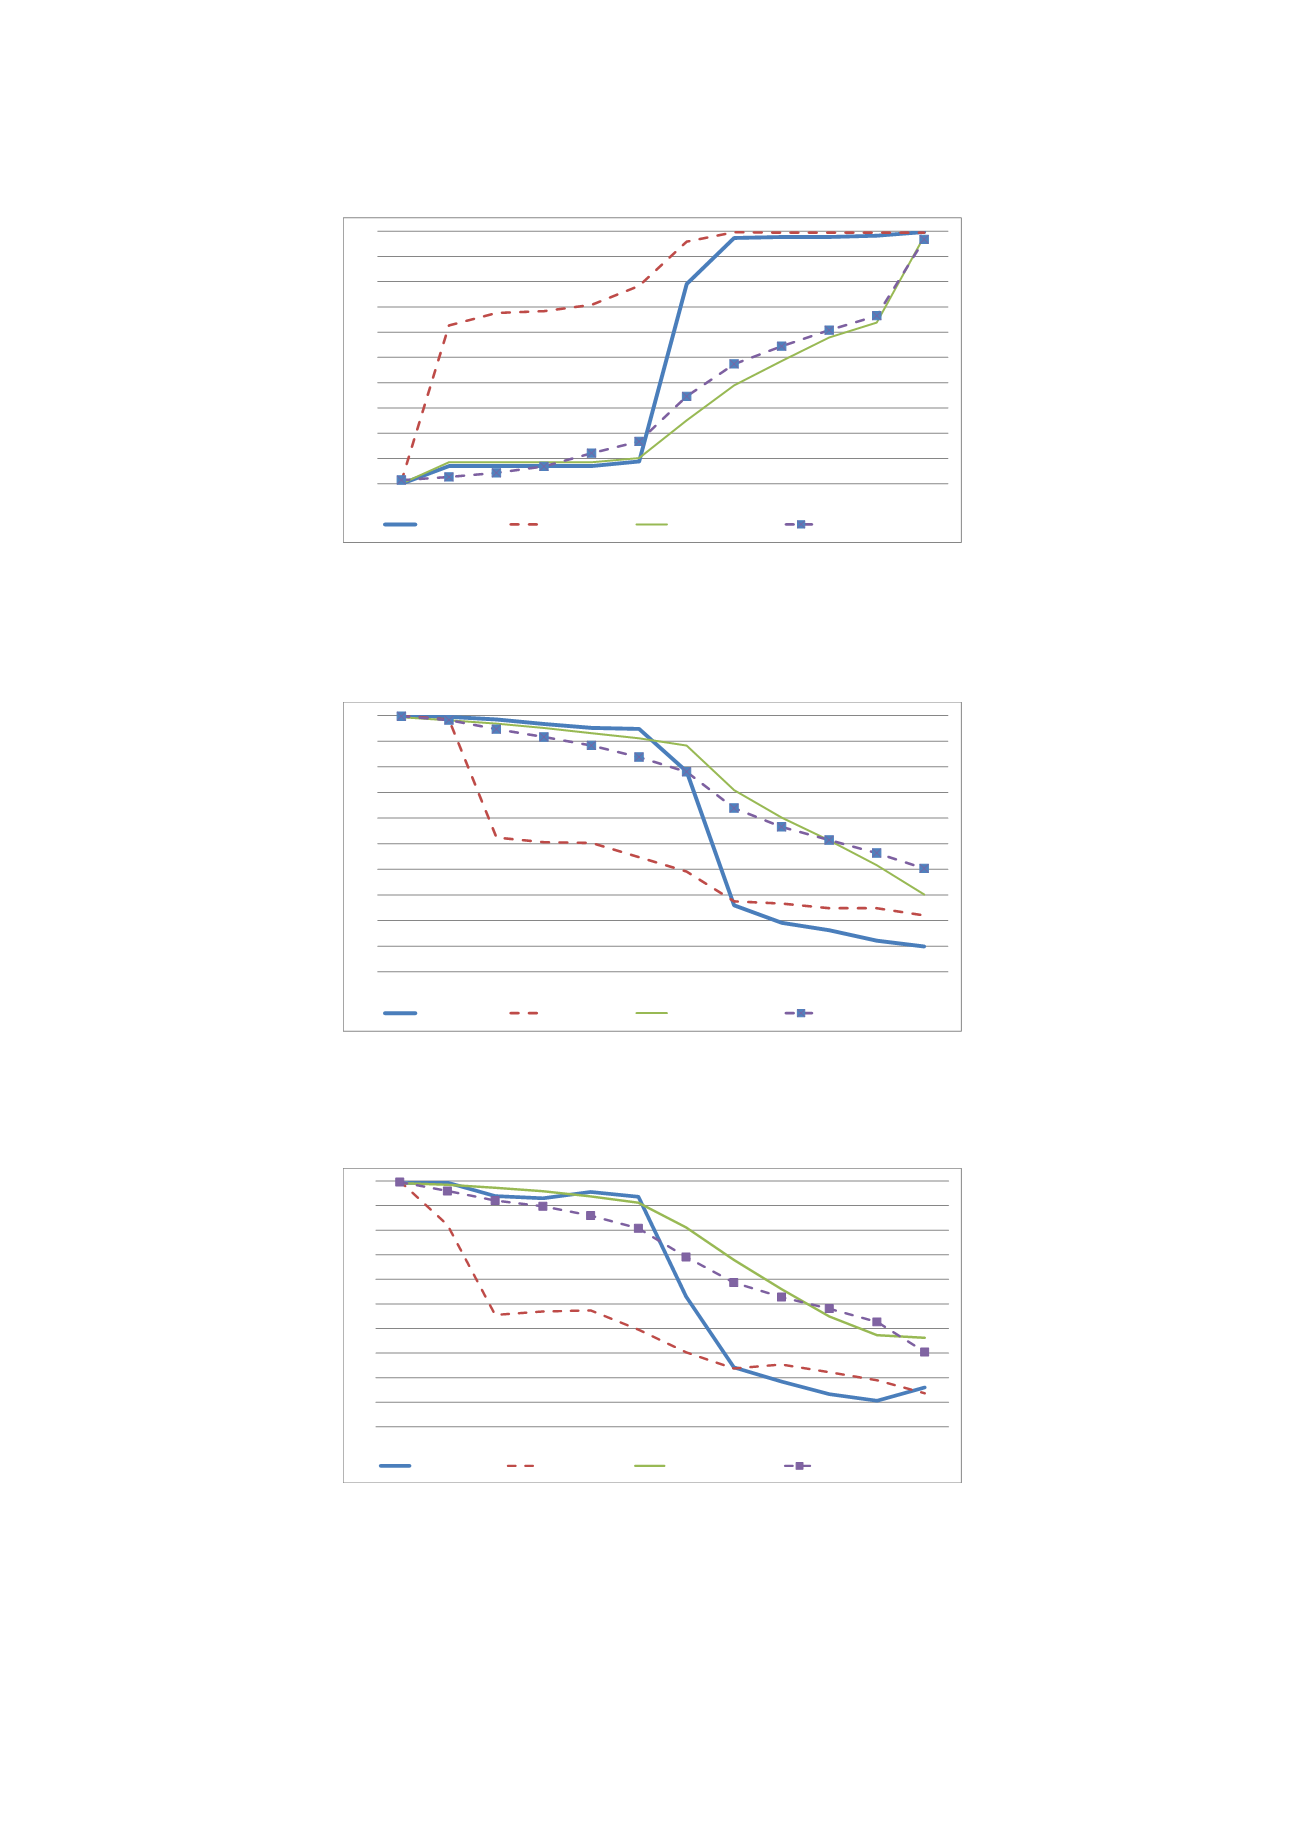
Figure 2: The take-up rate of occupational pension among military and non-military
government employees for the two cohorts 1931-1932 and 1938-1939
Note: For cohort 1931, ages 55-58, and cohort 1932, ages 55-57, the fractions are estimated with the value in 1990
(data on pension income starts in 1990).
Figure 3: Fraction employed among military and non-military government employees
for the two cohorts 1931-1932 and 1938-1939
Note: Employment status is defined as labor market income above one basic amount in a given year.
Figure 4: Fraction registered as gainfully employed among military and non-military
government employees for the two cohorts 1931-1932 and 1938-1939
Note: Gainful employment is defined according to the ILO definition, November each year, administrative registers
(RAMS, Statistics Sweden).
0
0.1
0.2
0.3
0.4
0.5
0.6
0.7
0.8
0.9
1
54
55
56
57
58
59
60
61
62
63
64
65
Military 1931-32
Military 1938-39
Non-military 1931-32
Non-military 1938-39
0
0.1
0.2
0.3
0.4
0.5
0.6
0.7
0.8
0.9
1
54
55
56
57
58
59
60
61
62
63
64
65
Military 1931-32
Military 1938-39
Non-military 1931-32
Non-military 1938-39
0
0.1
0.2
0.3
0.4
0.5
0.6
0.7
0.8
0.9
1
54
55
56
57
58
59
60
61
62
63
64
65
Military 1931-1932
Military 1938-1939
Non-military 1931-1932
Non-military 1938-1939


