


 12 / 20


12(20)
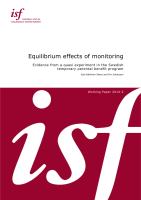
Table 1.
Descriptive statistics
Comparison group
Treatment group
Variable
Mean
95% CI
Mean
95% CI
Sum of gross benefit days
during 52 weeks preceding
the treatment assignment
9.170 [9.148–9.192] 9.189 [9.157–9.220]
Sum of gross benefit days
during 52 weeks following
the treatment assignment
8.240* [8.218–8.261] 8.132* [8.101–8.162]
Female
0.638 [0.637–0.639] 0.637 [0.636–0.639]
Married
0.556 [0.555–0.557] 0.556 [0.554–0.558]
Unmarried
0.384 [0.382–0.385] 0.384 [0.382–0.386]
Divorced
0.059 [0.058–0.060] 0.058 [0.058–0.059]
Widow/er
0.002 [0.001–0.002] 0.002 [0.002–0.002]
Lower secondary
education
0.057 [0.056–0.057] 0.056 [0.055–0.057]
Upper secondary
education
0.450 [0.448–0.451] 0.449 [0.447–0.450]
Post-secondary education 0.494 [0.493–0.495] 0.496 [0.494–0.497]
Age of the parent*
37.322 [37.318–37.34] 37.254 [37.23–37.27]
Number of children*
1.795 [1.793–1.797] 1.804 [1.802–1.807]
Youngest child < 1 years 0.011 [0.011–0.011] 0.012 [0.011–0.012]
Youngest child 1-3 years* 0.537 [0.536–0.538] 0.543 [0.542–0.545]
Youngest child 4-6 years* 0.277 [0.276–0.278] 0.274 [0.273–0.276]
Youngest child 7-11
years*
0.175 [0.174–0.176] 0.171 [0.169–0.172]
Born abroad
0.120 [0.119–0.120] 0.119 [0.118–0.120]
Yearly income/1000
308.8 [308.0–309.1] 308.2 [307.8–308.6]
Parental benefit days
1year before monitoring
5.476 [5.396–5.556] 5.428 [5.314–5.541]
Parental benefit days 1
year after monitoring
4.110 [4.043– 4.176] 4.129 [4.034–4.224]
Sickness benefit days 1
year before monitoring
1.715 [1.670–1.759] 1.691 [1.628–1.755]
Sickness benefit days 1
year after monitoring
1.306 [1.268–1.344] 1.295 [1.241–1.349]
Note: The difference between the treatment and the comparison group is statistically
significant on 5 per cent level is denoted with *. We have in addition tested for
differences across counties. No statistically significant regional difference was found.