16(23)
-1
-0,5
0
0,5
1
4
8 12 16 20 24 28
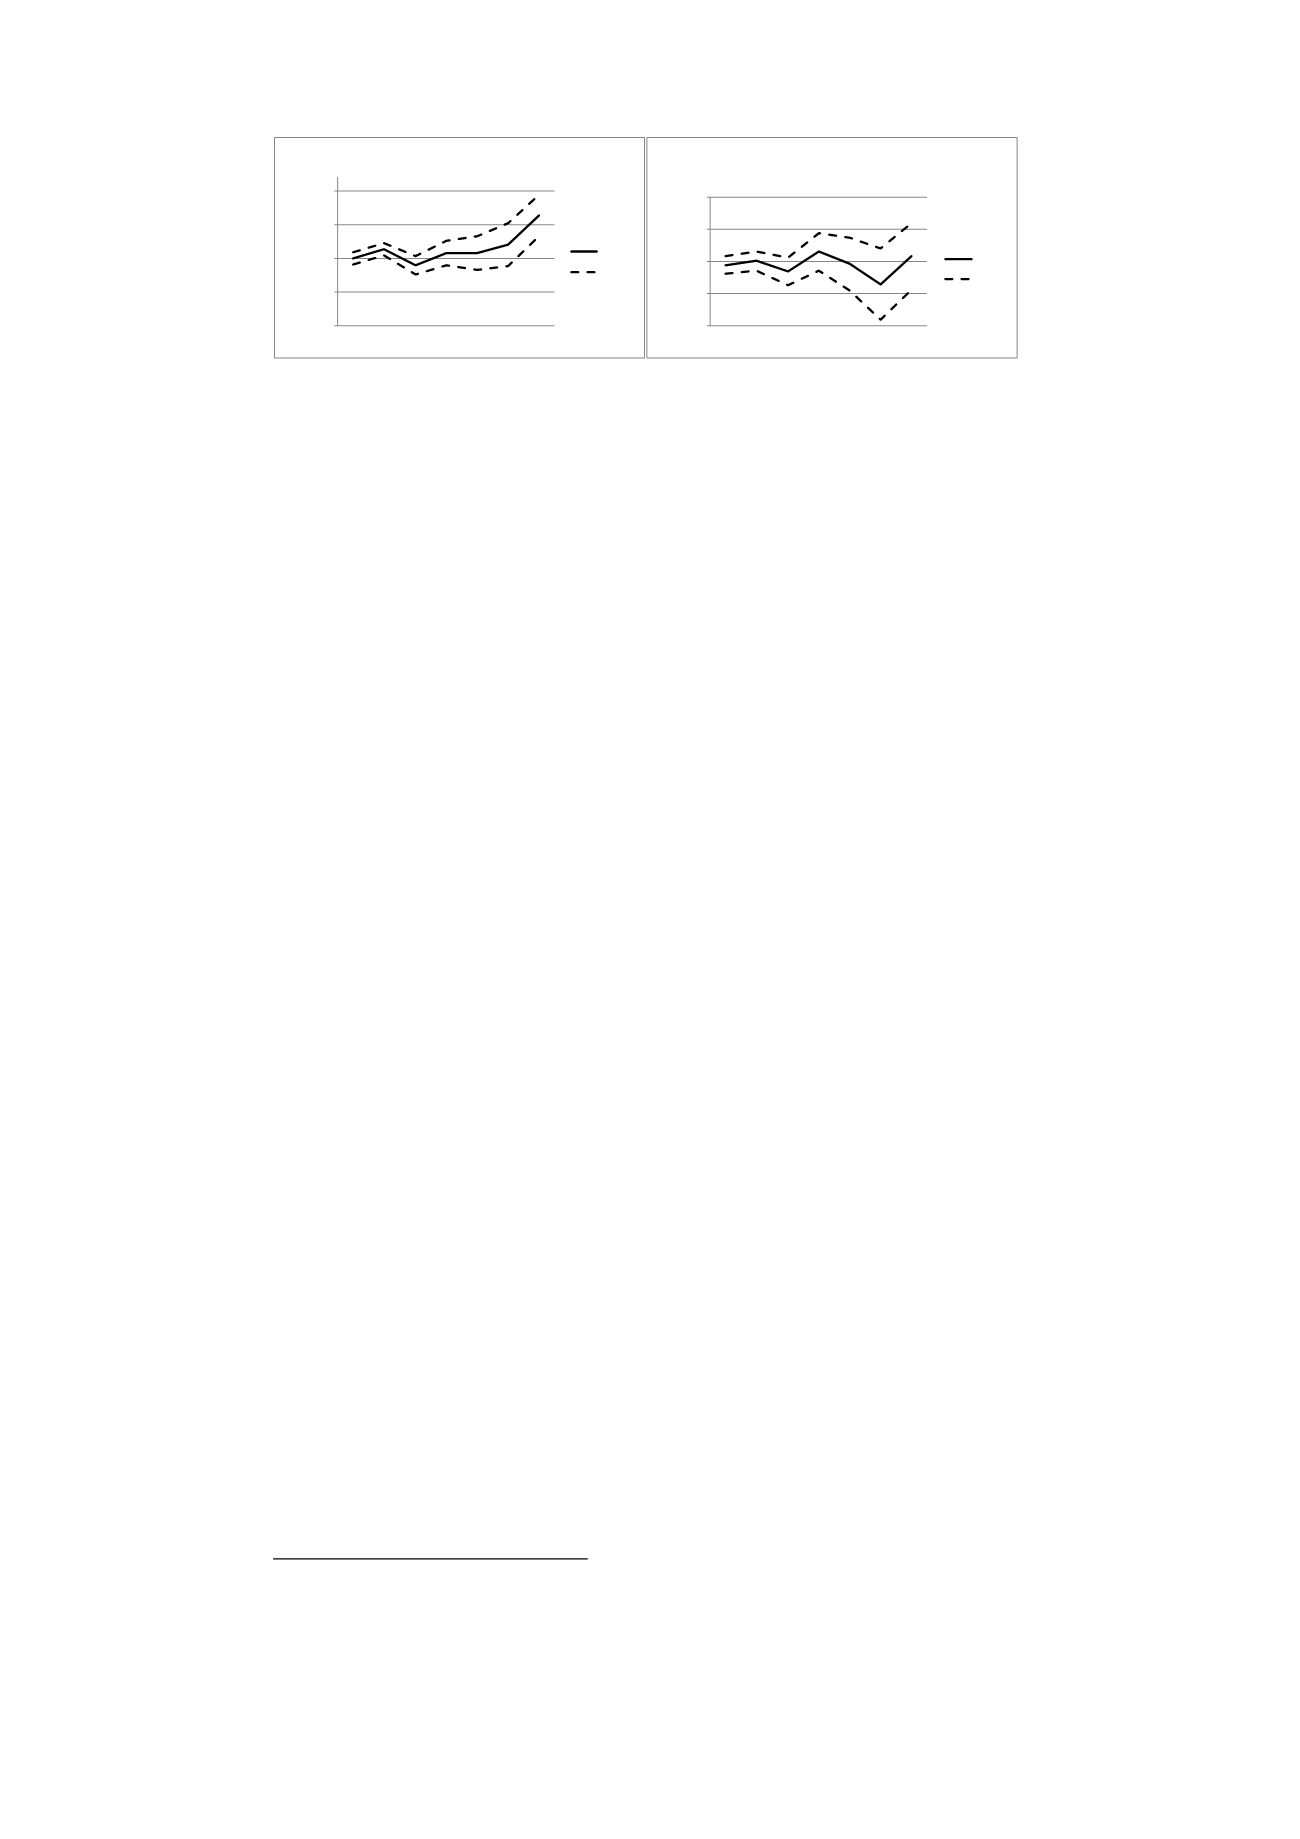
Hazardrate
Weeks
Figure 4a: Effect on hazard, big city areas
Effect
95%CI
-1
-0,5
0
0,5
1
4
8 12 16 20 24 28
Hazardrate
Weeks
Figure 4b: Effect on hazard rate, sparsely
populated areas
Effect
95%CI
5.4
The effect on future sick reporting
Time limits and stricter enforcement of the SI rules are, besides shorter
sick spells, also expected to have an impact on the inflow to the SI system.
This could potentially constitute a selection problem in this study comparing
sick spells initiated before and after the reform. However, a brief look at
the data gives no such indication. Comparing June–July inflow quotes from
2000 onward, the ratio is typically around 1.1 (1.09 on average). The 2008
ratio is 1.03, which is lower than the 2007 ratio of 1.13. The July inflow in
2008 was thus the opposite to what one would might have expected:
relatively large compared with previous years.
The stricter SI rules could especially be expected to affect the sick-leave
behavior among those recently reported sick. Setting a restriction on the
length of the period following the sick spell, I analyse whether the positive
effects found in the main analysis are the effect of short-term or long-term
working spells.
Figure 5 illustrates the effect of the rehabilitation chain at different
durations when experimenting with alternative definitions of when a sick
spell has ended. I analyse the effect using the restrictions 12 and 26 weeks
respectively on the subsequent working spells. That means that reporting
sick again within 11 and 25 weeks of the last sick spell respectively, does
not qualify as ending it
Only small deviations are found compared with the main analysis, at least
up to 24 weeks. The positive impact at 5-8 weeks was thus the result of
neither shorter nor longer work spells. The effect at 6 months, on the other
hand, seems to have been generated by on average longer work spells. The
positive impact increases from 60.7% (main analysis) to 89% using a 12-
week restriction, i.e. with approximately 50%. Instead of using a 26-week
restriction, the impact increases to about 94%. The effect thus corresponds
to almost twice as many sick reported ending their sick spells at this
duration compared with the situation without the 181-day assessment. The
results indicate that the rehabilitation chain did not only increase the exit
rate from the SI system; it also created disincentives to report sick, hence
prolonging the subsequent periods of work. This conclusion should however
be reserved for the probability that those who ended their sick spell around
the 181st day in the treatment group were healthier on average than their
comparisons in the non-treatment group. This would then be expected to
affect the future risk of sickness absence.
6
To exemplify: a person is reported sick for 8 weeks and then returns to work for 11
weeks. The person then once again reports sick for another 8 weeks before going
back to work for 26 weeks. If the work-spell restriction is set to 12 weeks, the total
sick spell becomes 16 (8+8) weeks.


