12(23)
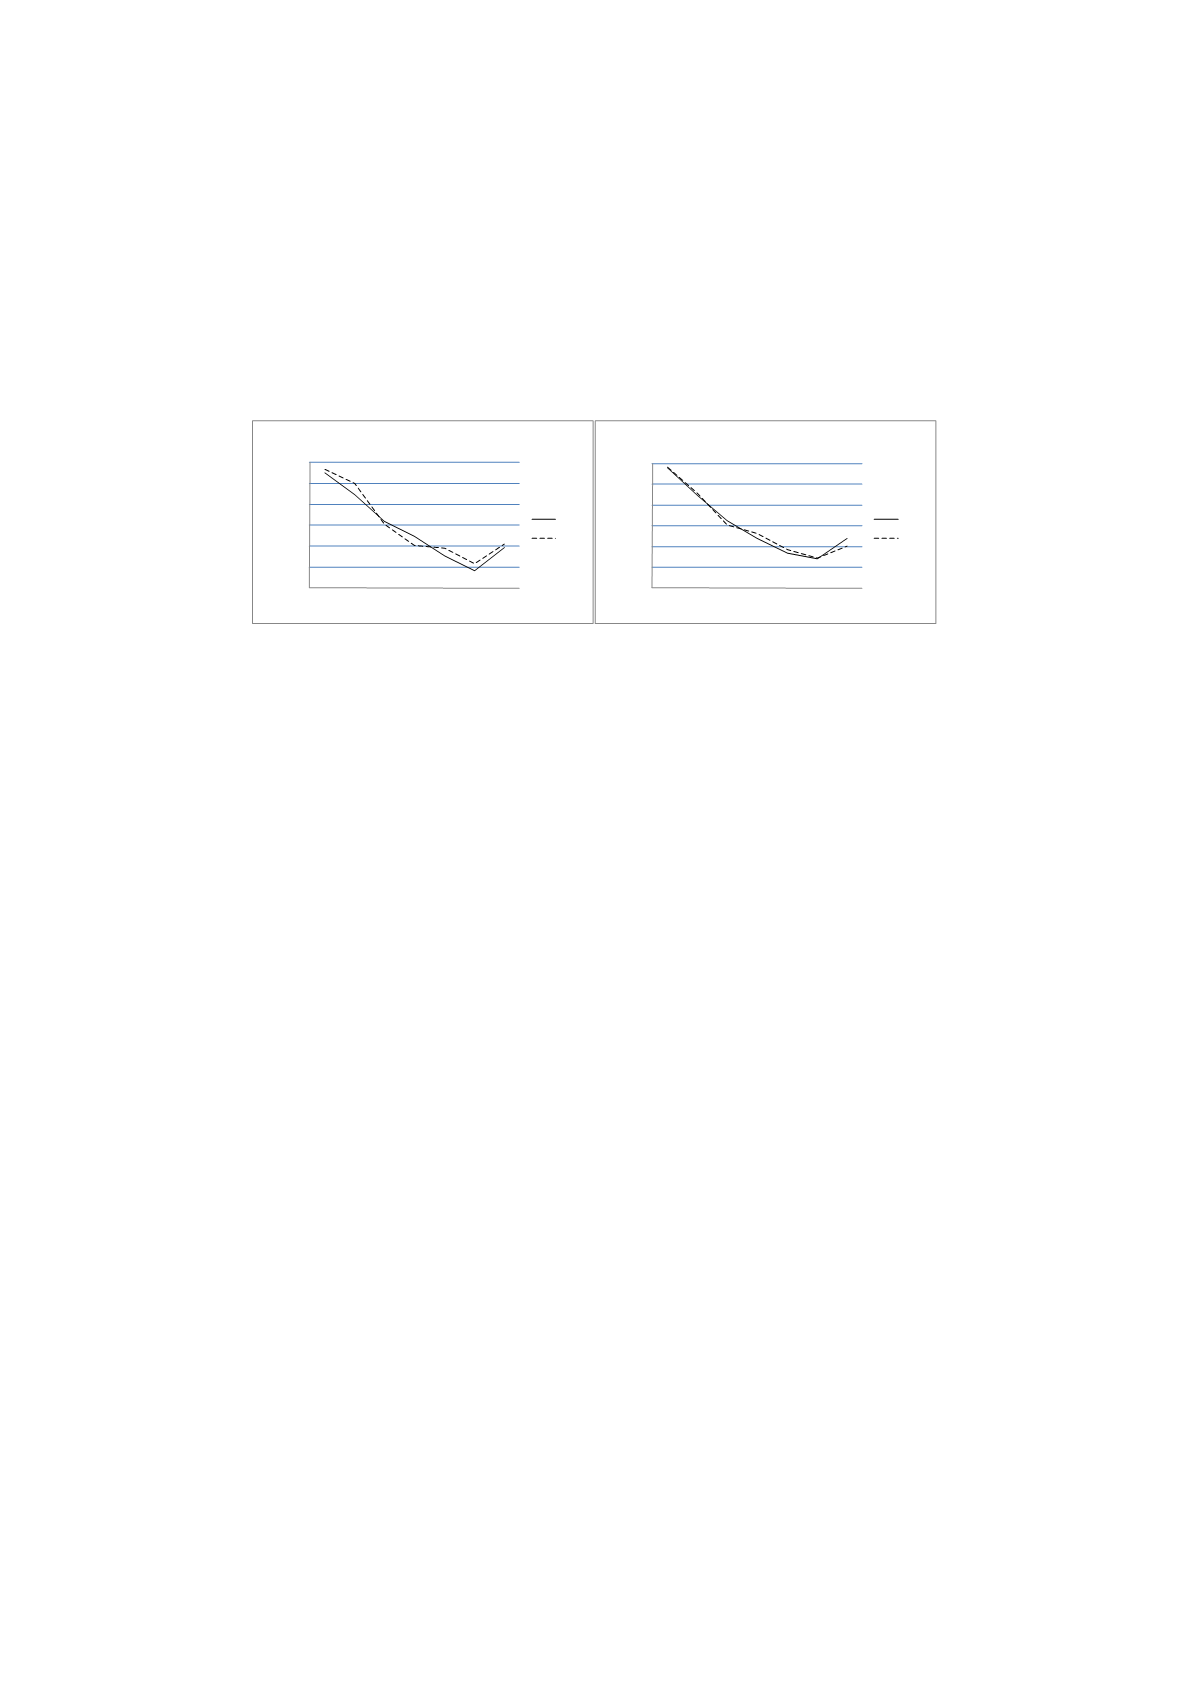
Figures 1a-b illustrate the Kaplan–Meier estimates for sick spells started in
each year. A positive effect of the rehabilitation chain would be shown in a
relatively higher exit rate for the July spells in 2008 compared with 2007,
especially close to days 91 (≈13 weeks) and 181 (≈26 weeks) in the sick
spell. No such clear pattern is found. However, in correspondence with the
results from Table 2, the increase in the exit rate between 2007 and 2008
is higher in the July group than in the June group. In the 26-28 week
interval in 2008, the exit rate is even higher in the July group. Whether this
is an effect of the introduced time limits or not is investigated in the
following section.
0
0,1
0,2
0,3
0,4
0,5
0,6
6 10 14 18 22 26 28
Hazardrate
Figure 1a: Sick-spell hazards, June and
July 2007
July
June
0
0,1
0,2
0,3
0,4
0,5
0,6
6 10 14 18 22 26 28
Hazardrate
Figure 1b: Sick-spell hazards, June and July
2008
July
June


