15(23)
5.3
Effects for different subgroups
Both the ability and the incentives to work are expected to vary among the
sick-reported. We would therefore expect the impact of the time limits to
diverge between groups in the sample.
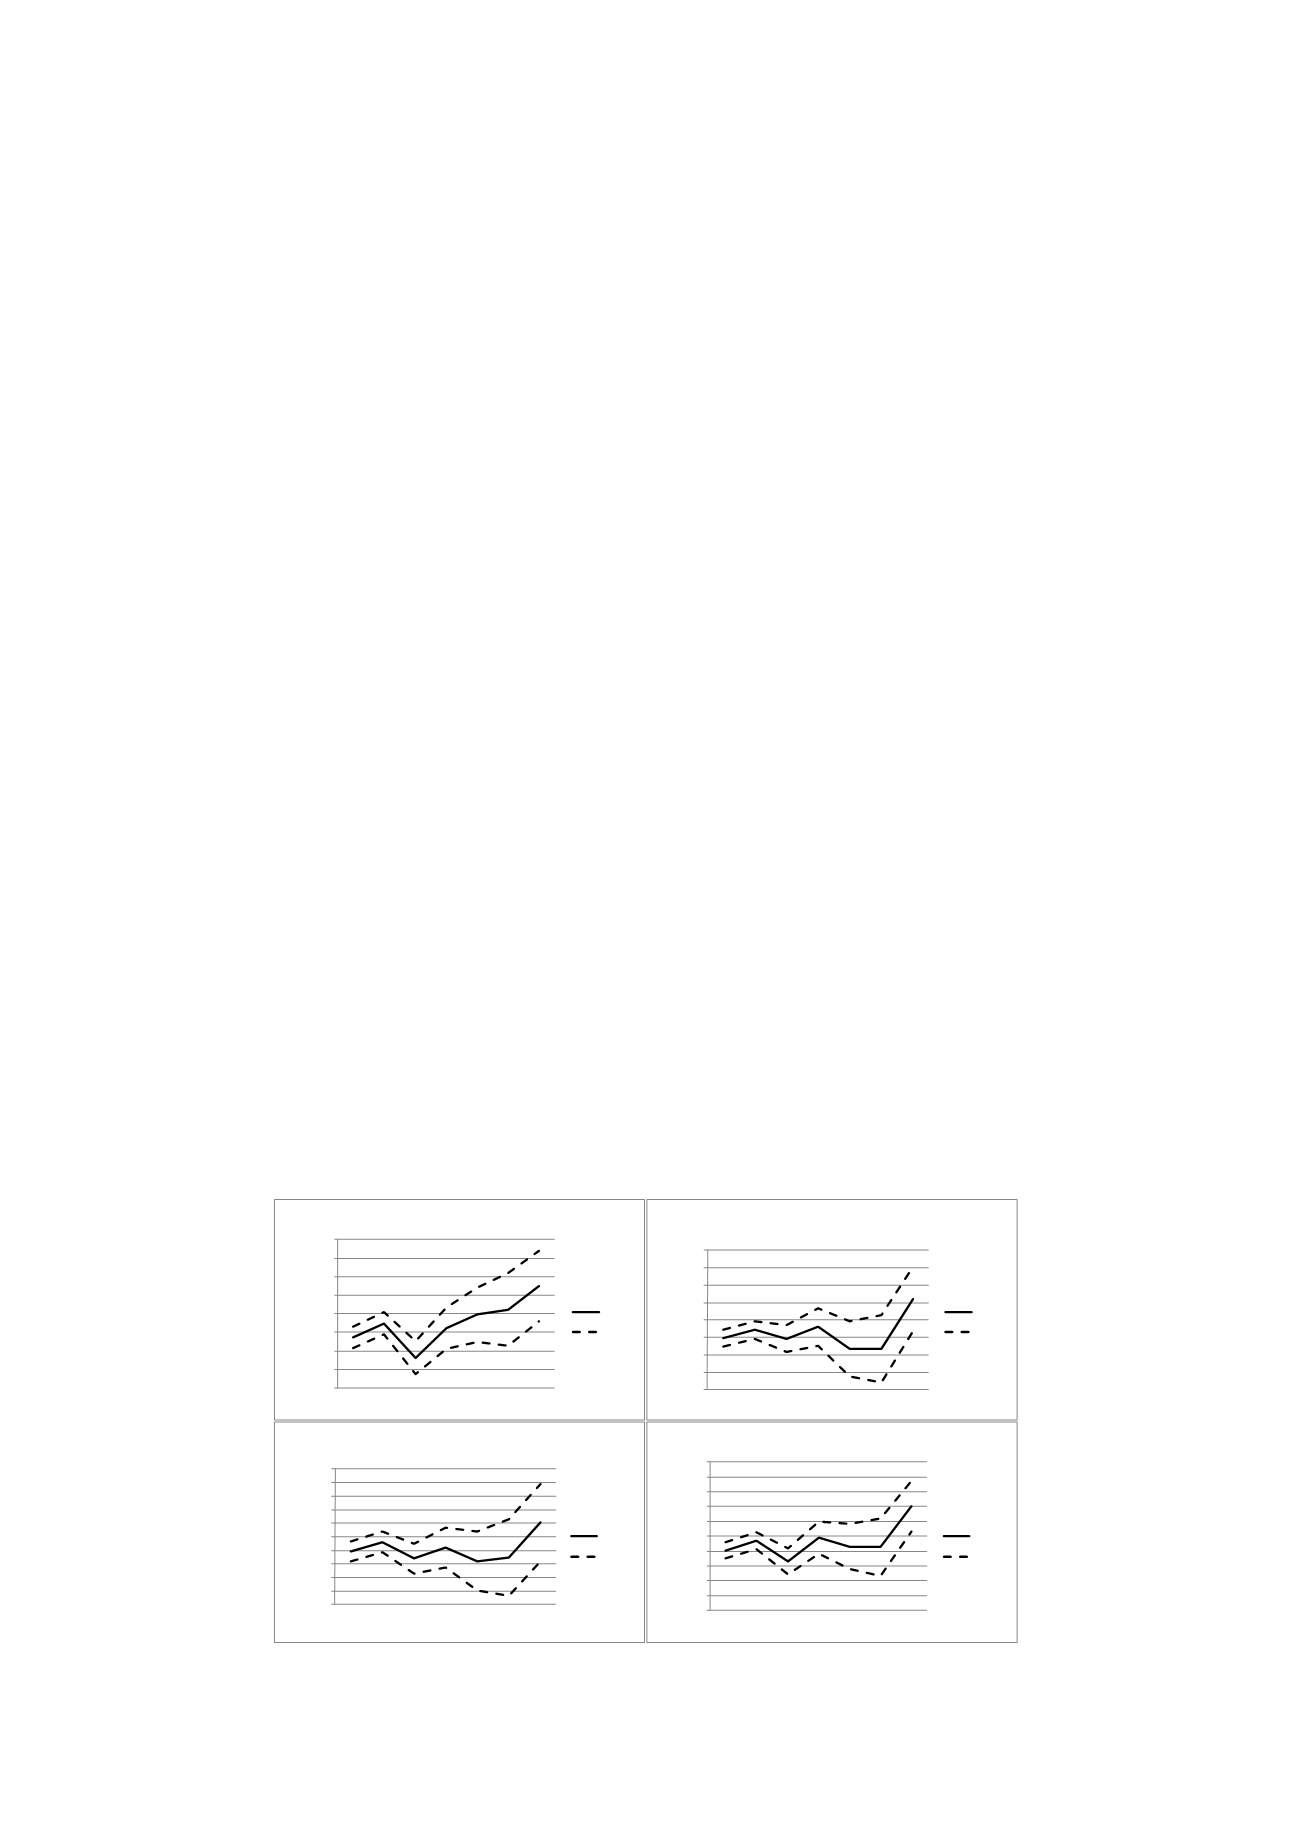
Figures 2a-4b illustrate the effect of the rehabilitation chain at different
durations on some chosen subgroups. There are only small differences
between men and women (2a-b); both show sharp increases in the exit
rate preceding the 181-day assessment. The reform seems to have had a
somewhat more positive effect on older (45+) than on younger individuals.
In contrast to the older sick reported (3a-b), the impact on younger sick
reported is not significant around 6 months. The difference in the results is
due to both lower precision and a smaller impact estimate for the younger
sick reported. A careful interpretation is that the on average more favorable
labour market situation for older involves better opportunities to return to
work.
Finally, Figures 4a-b illustrate the importance of the local labour market to
the reform impact. Figure 4a reports significant and positive effects before
both the 91st and the 181st day of the sick spell for an average of the big-
city areas of Stockholm, Gothenburg and Malmö. Similar results are not
found in the more sparsely populated municipalities. To some extent, the
results are expected due to health differences in different parts of the
country. However, a more favorable local labour market situation would
also correlate with stronger incentives to work. Comparing unemployment
rates, the unemployment rates were 7.3 and 8.1 in the large city areas and
small municipalities, respectively.
An alternative hypothesis is that the results derive from differences in
norms and attitudes towards sickness absence. Hesselius, Johansson and
Nilsson (2009) find that when the sickness absence increases among
working colleagues, it positively affects the individual’s sick-report rate.
Comparing sick leave between different cities shows that the average
number of compensated sick days in big city areas was 34, and 42 in
sparsely populated areas. The large difference suggests that besides health
issues other explanations exist related to the local use of the sickness
insurance system. These factors could also affect the potential for the
rehabilitation chain to be successful in shortening sick spells.
-0,6
-0,4
-0,2
0
0,2
0,4
0,6
0,8
1
4
8 12 16 20 24 28
Hazardrate
Weeks
Figure 2a: Effect on hasard, men
Effect
95%CI
-0,6
-0,4
-0,2
0
0,2
0,4
0,6
0,8
1
4
8 12 16 20 24 28
Hazardrate
Weeks
Figure 2b: Effect on hazard, women
Effect
95%CI
-0,8
-0,6
-0,4
-0,2
0
0,2
0,4
0,6
0,8
1
1,2
4
8 12 16 20 24 28
Hazardrate
Weeks
Figure 3a: Effect on hazard, <35 years
Effect
95%CI
-0,8
-0,6
-0,4
-0,2
0
0,2
0,4
0,6
0,8
1
1,2
4
8 12 16 20 24 28
Hazardrate
Weeks
Figure 3b: Effect on hazard, 45- years
Effect
95%CI


