13(27)
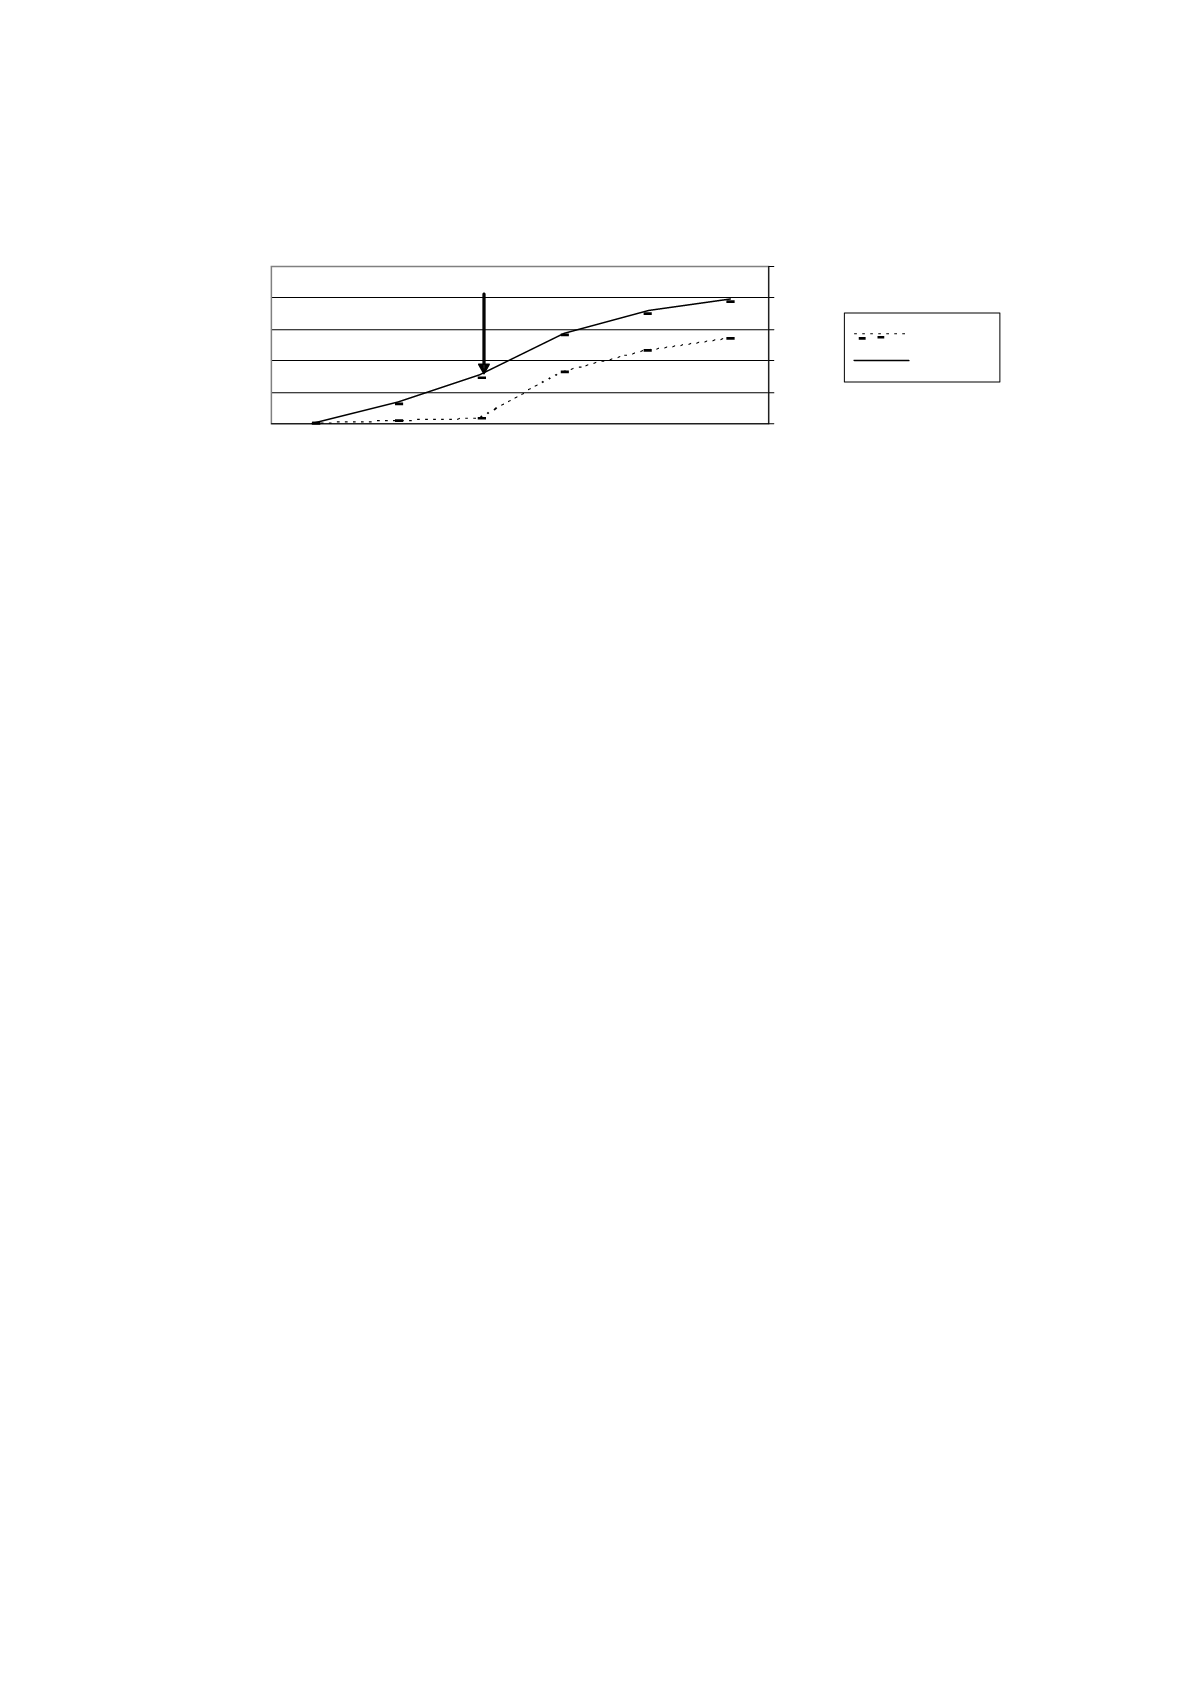
Figure 2. Distribution of overcrowding (norm 3), cumulative percent, for
treatment and control groups.
The treatment group was much less likely to move into overcrowded
conditions before the reform than was the control group. This was probably
because the treatment group consisted of households that lived in relatively
spacious conditions before the reform and, therefore, may also be a group
of consumers that prefers spacious housing. Moreover, as shown by the
figure, members of this group were more likely to move into overcrowded
conditions after the 1997 reform, as were members of the control group.
Since the probabilities of moving into overcrowding conditions differ
between the treatment- and the control group before the reform we will
also estimate the effect from a “placebo reform”, i.e., we will implement
the size limit one year earlier in the analysis. If we find no effect from this
placebo reform, this will increase the credibility that we have been able to
isolate an effect from the reform. Table 2 presents some descriptive
statistics for May 1996, the year before the reform, for the treatment and
control groups.
Households living in overcrowded conditions: cumulative percent
0%
5%
10%
15%
20%
25%
1995
1996
1997
1998
1999
2000
Year
Treatment
Control
Reform


