


 20 / 22

20(21)
Appendix
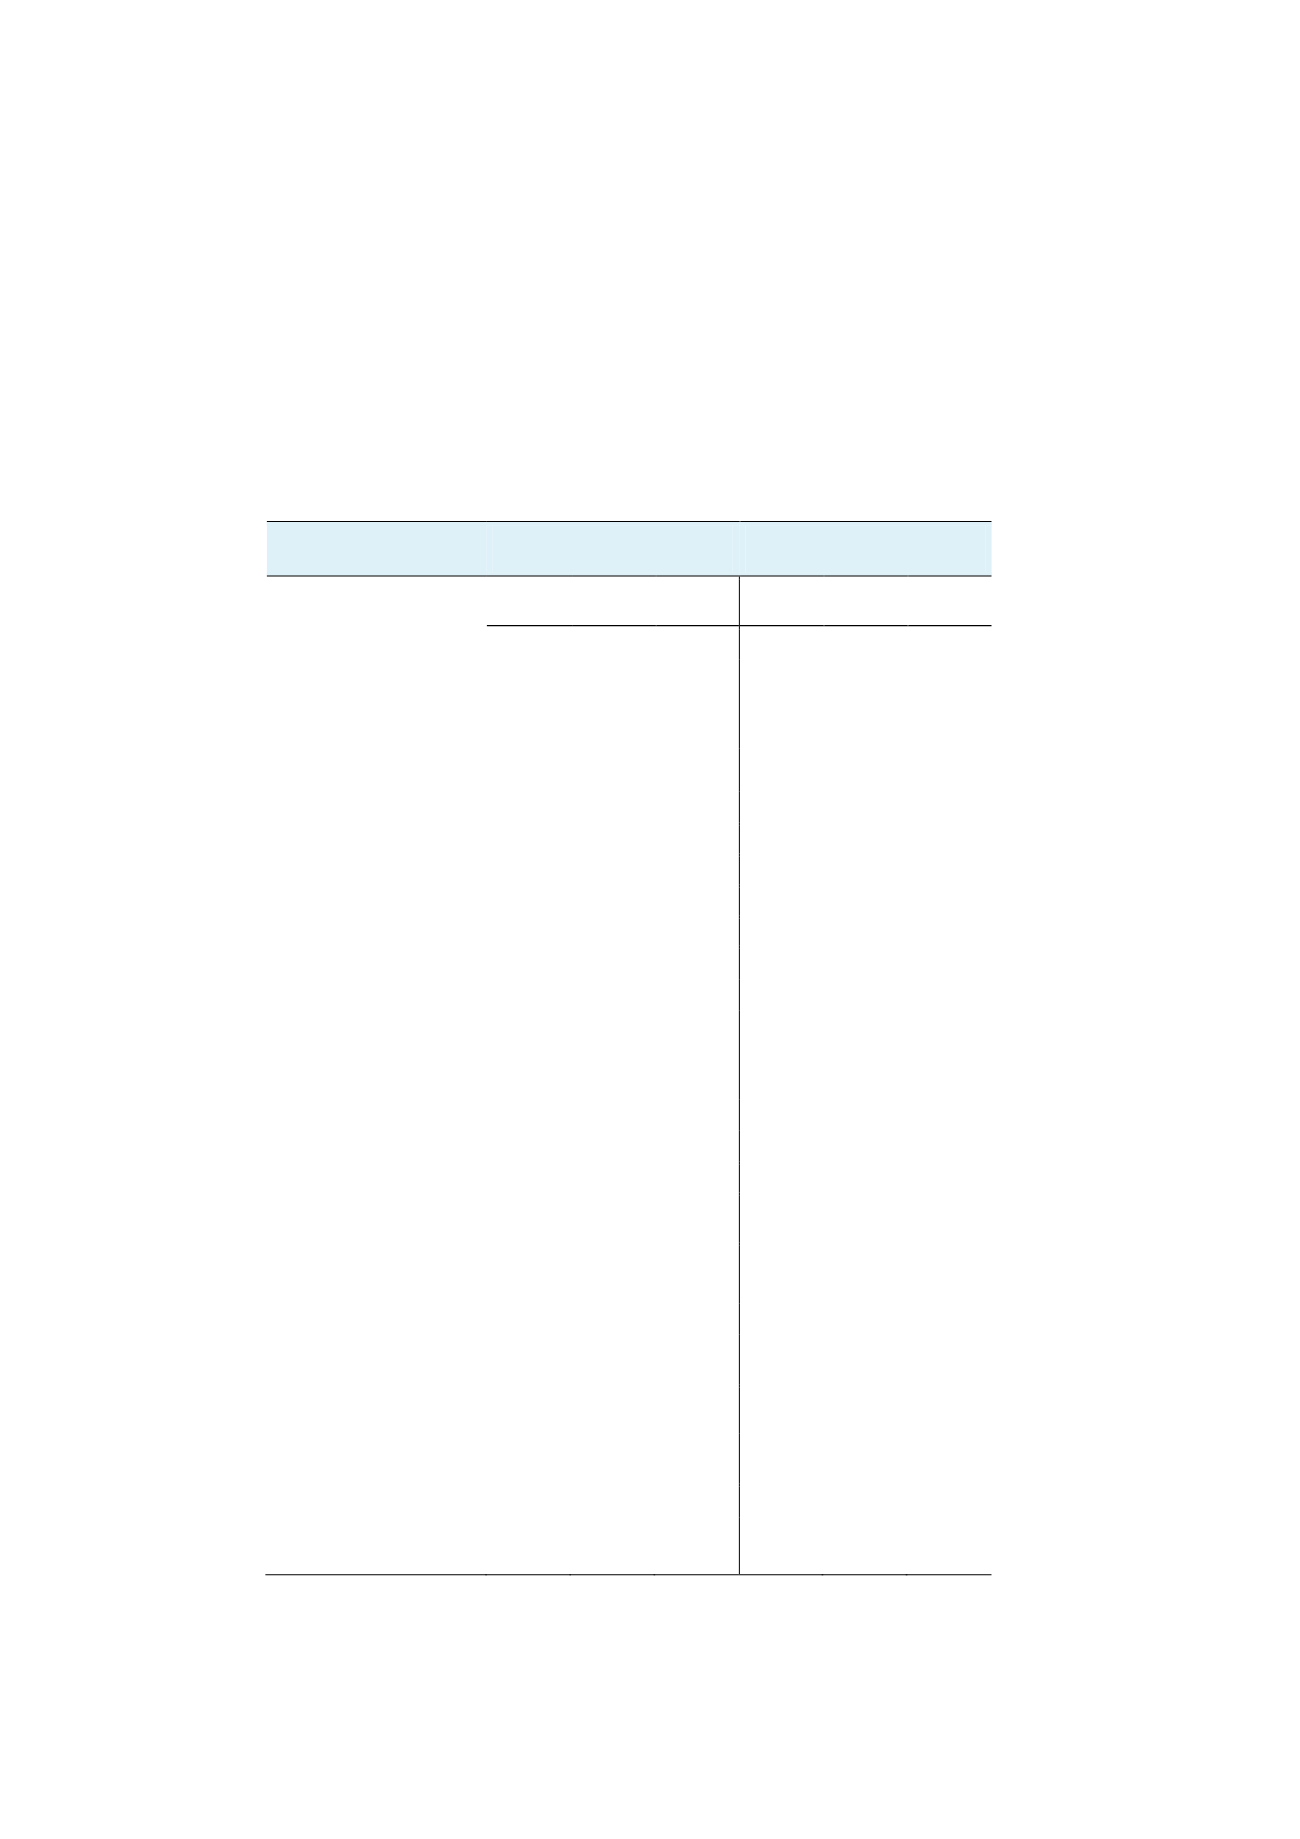
Table A1.
Characteristics of individuals´ assigned caseworkers positive
and negative to rehabilitation measures and SI rules
respectively
Rehabilitation
SI rules
Neg.
Pos.
Sign.
Neg.
Pos.
Sign.
Man
0.40
0.38 ***
0.40
0.38 ***
Married
0.47
0.46
0.46
0.47
Children under 18
0.39
0.39
0.39
0.39
Age
46.9
(11.8)
47.0
(11.9)
46.7
(11.9)
47.1
(11.8)
***
Foreign-born
0.14
0.15
0.14
0.14
Educational level
Pre high school
0.16
0.16
0.16
0.16 **
High school
0.54
0.53
0.54
0.54
Post high school
0.30
0.31 **
0.30
0.31 ***
Maximum benefits
0.17
0.16 **
0.17
0.17
Sector
Municipality
0.25
0.26
0.25
0.27 ***
County council
0.08
0.09 ***
0.08
0.09 ***
Private
0.46
0.45 ***
0.47
0.44 ***
Other
0.21
0.20 ***
0.21
0.20 ***
Diagnosis
Mental illness
0.24
0.24
0.24
0.24 **
Muscoloskeletal
disorder
0.28
0.27
0.27
0.28
Injuries, poisoning 0.15
0.15 **
0.15
0.15
Other
0.33 0.34
0.33 0.34
Sickness benefit days
since 2000
334
(504)
342
(517)
**
335
(508)
337
(510)
Disability benefit days
since 2000
8
(130)
6
(114)
8
(135)
6
(110)
**
Unemployment days
since 2000
457
(813)
457
(812)
467
(820)
446
(805)
***
Number of
observations
37,731 27,431
33,828 31,334
Note
: **/*** indicates statistical significance at 5/1 percentage level respectively.