28(34)
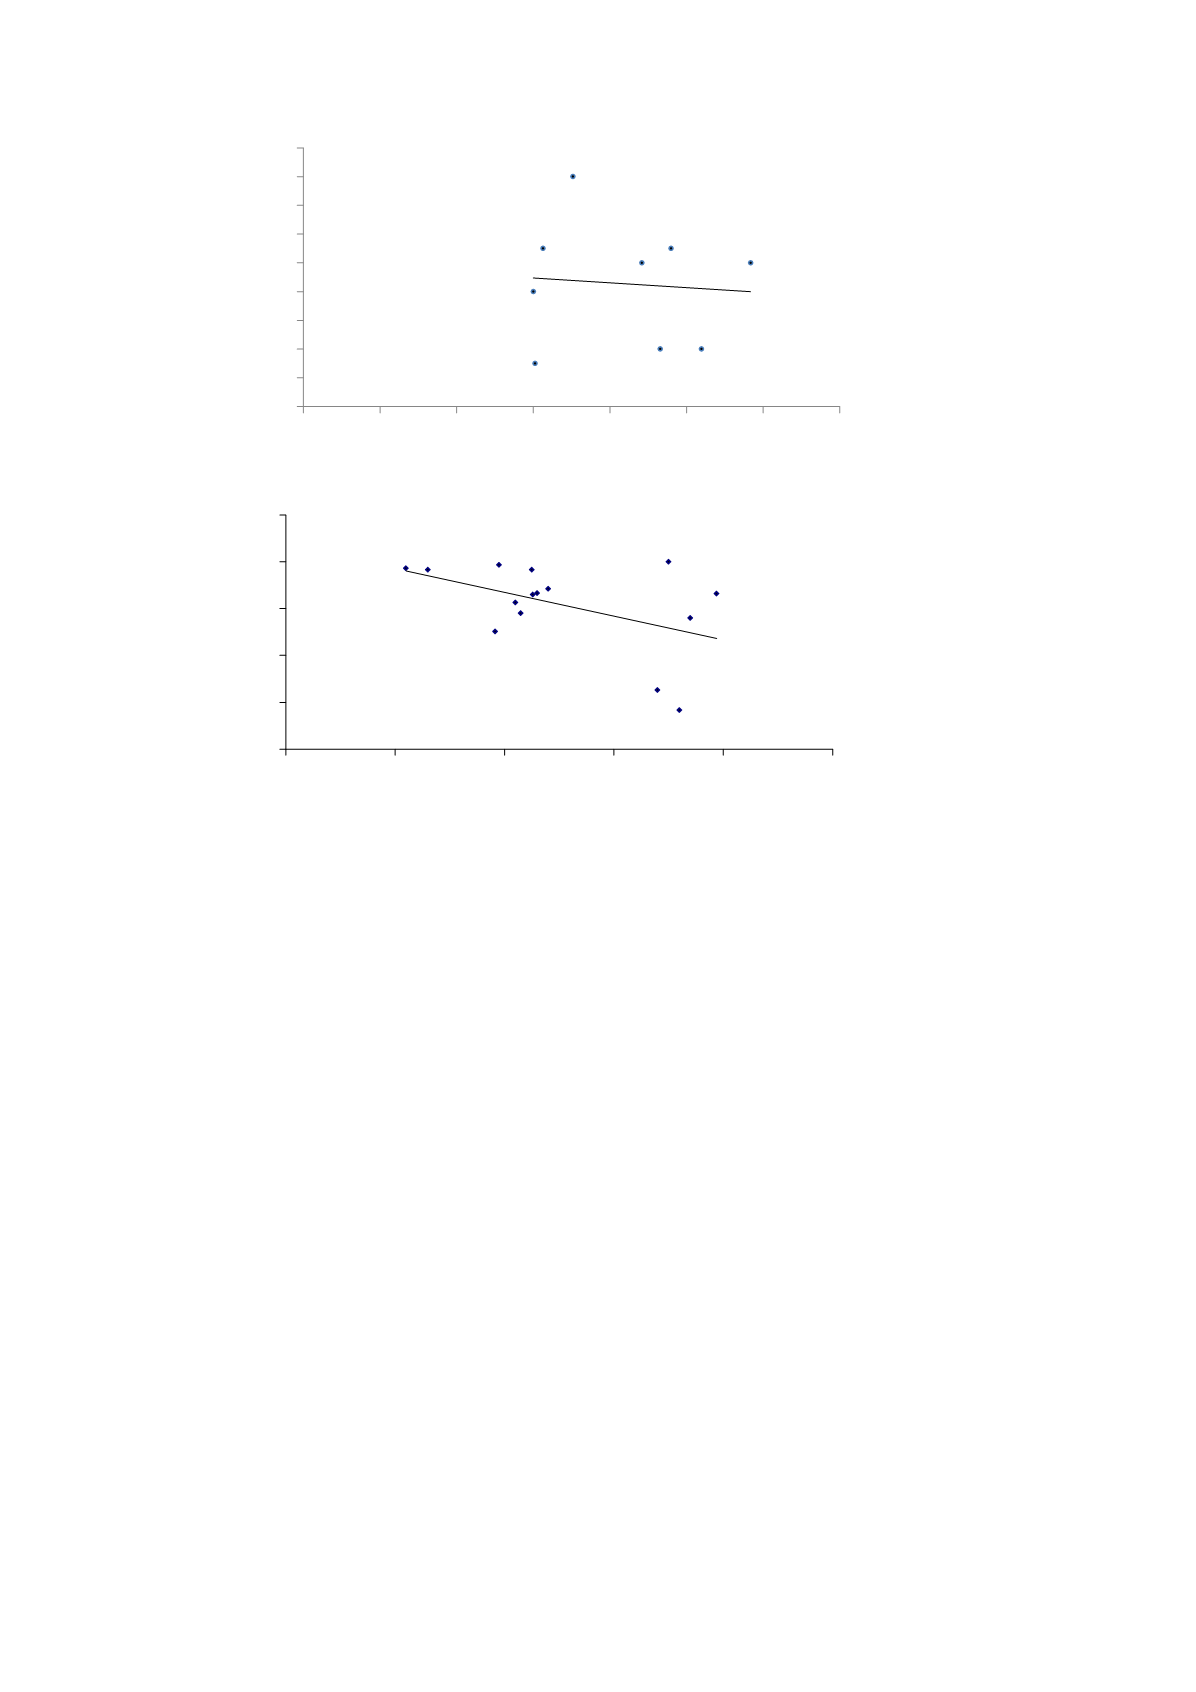
Figure 3
. Correlation between Price (SEK, x-axis) and Quality Score (y-
axis) for i) Architectural Services, ii) IT Management, and iii)
PR Services.
The break-even point computed from the sample is about 5 000 EUR. This
is where the expected gain balances the average cost of a procurement
operation. This value is in fact based on an underestimate of the gains
derived from formal procurement. According to the definition chosen, no
gain is registered if only one tender is submitted, although we know that
the mere condition of being exposed to potential competition will affect
prices downwards–20 percent in an example from the procurements under
study. On the other hand, the value is too low to be used as a general
procurement threshold. Normally, one would require that the procedure
yield a positive value-added in a qualified majority of all procurements.
Depending on what is required in this respect, the original value should be
multiplied by a factor of 2 to 3. The general conclusion is that the current
threshold value used in Sweden, 30 000 EUR, seems to be well defended by
the empirical data, even if requirements on safety margins are strong.
The method applied can also be used for computing adequate thresholds
for simpler versions of procurement than the open advertised procedure. In
this case, a lower threshold value is obtained, and the higher threshold
value corresponding to open procurement is correspondingly adjusted
upwards.
The threshold values computed depend on administrative costs and
potential gains, both of which will vary from country to country.
Administrative costs are determined by salaries, bureaucratic efficiency,
and other variables, while potential gains will depend on the typical market
y = -0,0003x + 9,981
R² = 0,0071
0
2
4
6
8
10
12
14
16
18
0
1000 2000 3000 4000 5000 6000 7000
y = -0,0005x + 6,3934
R² = 0,2288
0
1
2
3
4
5
4000
5000
6000
7000
8000
9000


