26
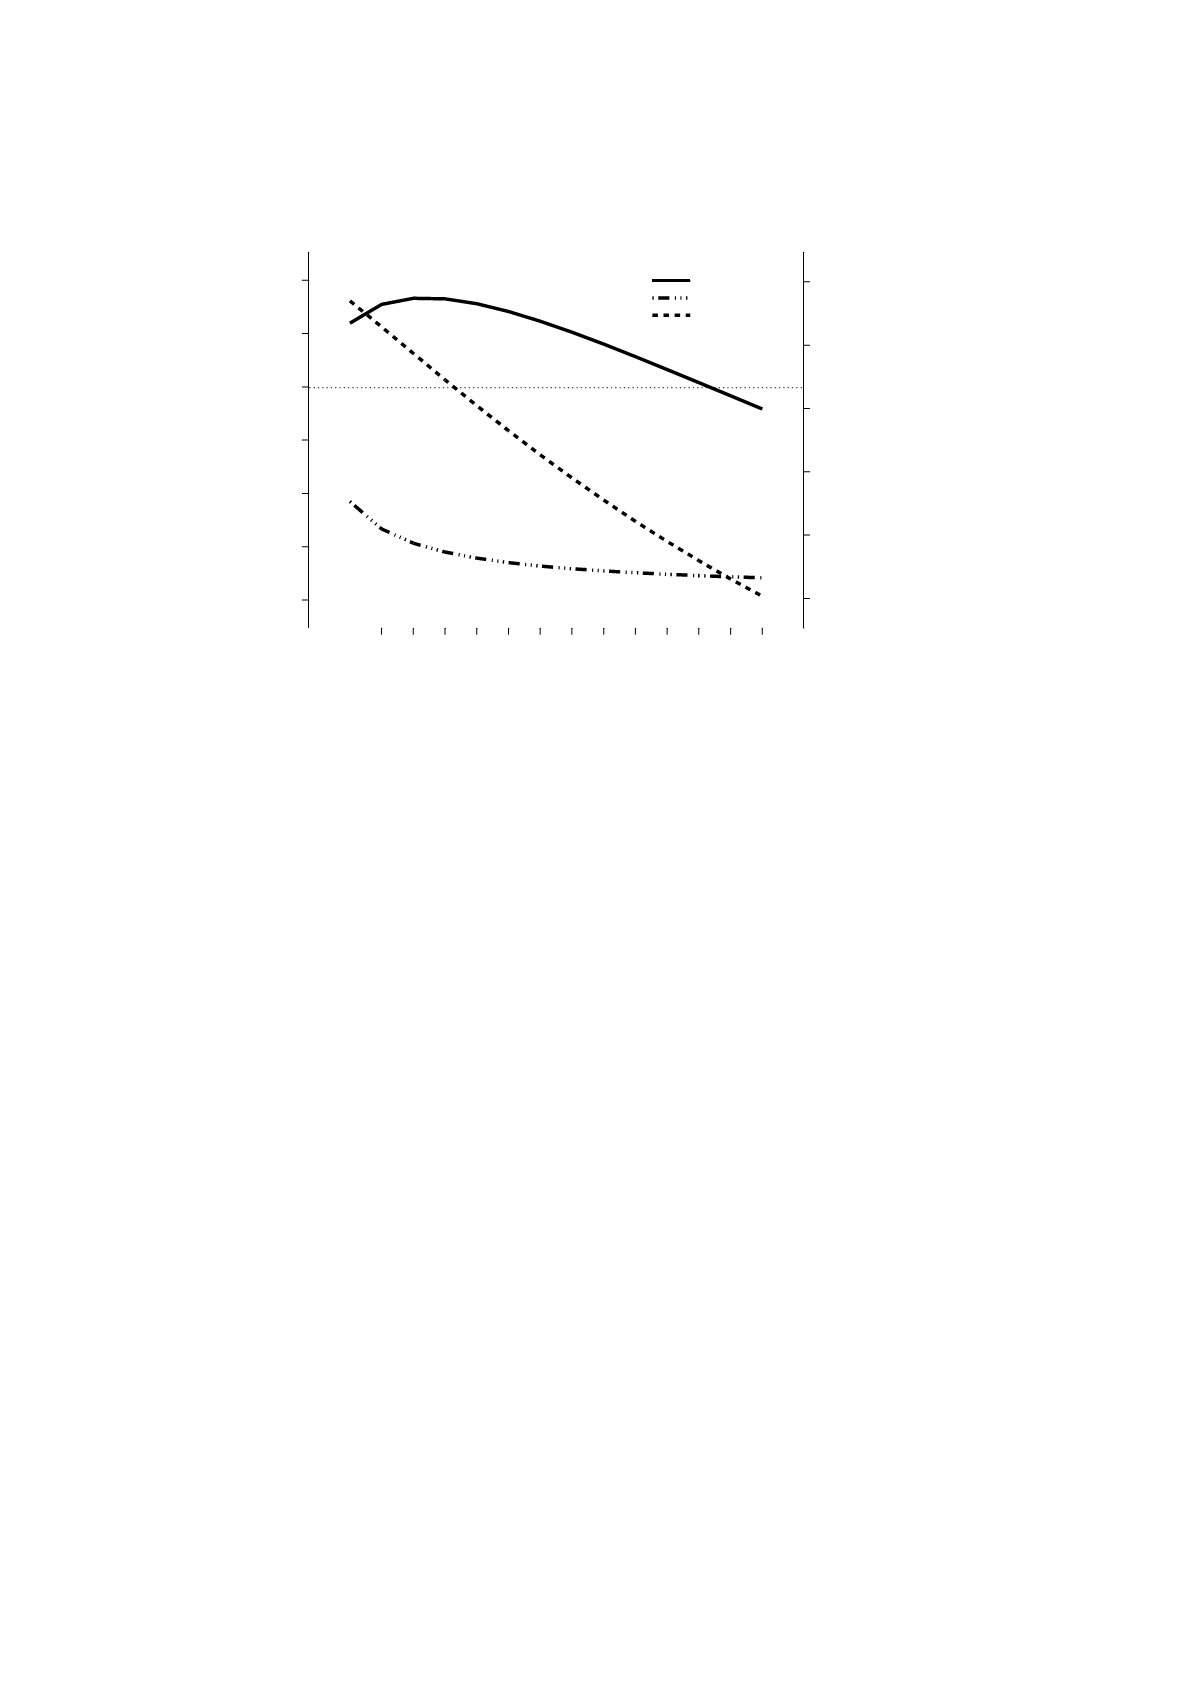
Figure 4.
The relative risk or odds ratio (treated/controls) of being in each
state, SB, Work, or DB
Figure 5 shows the difference between treatment and control group probabilities of
receiving DB for different levels of (un)health. For individuals with good health (low
h
) the
difference is very small. For individuals with less good health the effect of treatment is
more important. As our model setup is symmetric with respect to pecuniary incentives
and health, the theoretical implication of being unhealthy is the same as the effect of
having low costs of receiving DB. This implies that increased access to early interventions
will be more important for individuals with lower incentives to return to work (low cost or
bad health). The benefits in the Sickness insurance are typically higher than the benefits
in unemployment insurance (see section 2). This implies that most unemployed have
economic incentives to become and also stay sick. It is also highly likely that the
unemployed individuals have worse health than employed individuals. The implication
from our model is then that as the unemployed have larger incentives to communicate
bad health the treatment effects would be larger for them than for employed individuals.
Since we have information on individual employment status we have an empirically
testable result that we will address in the next section.
Janua ry Ap ril
Ju ly Octobe r Janua ry
0 .96
0 .97
0 .98
0 .99
1 .00
1 .01
1 .02
1 .19
1 .20
1 .21
1 .22
1 .23
1 .24
D isab ility
Sickness
W ork
Disability
The re la tive risk o f be ing s ick , work ing
and be ing d isab led if trea ted early
S ickness and work


