10
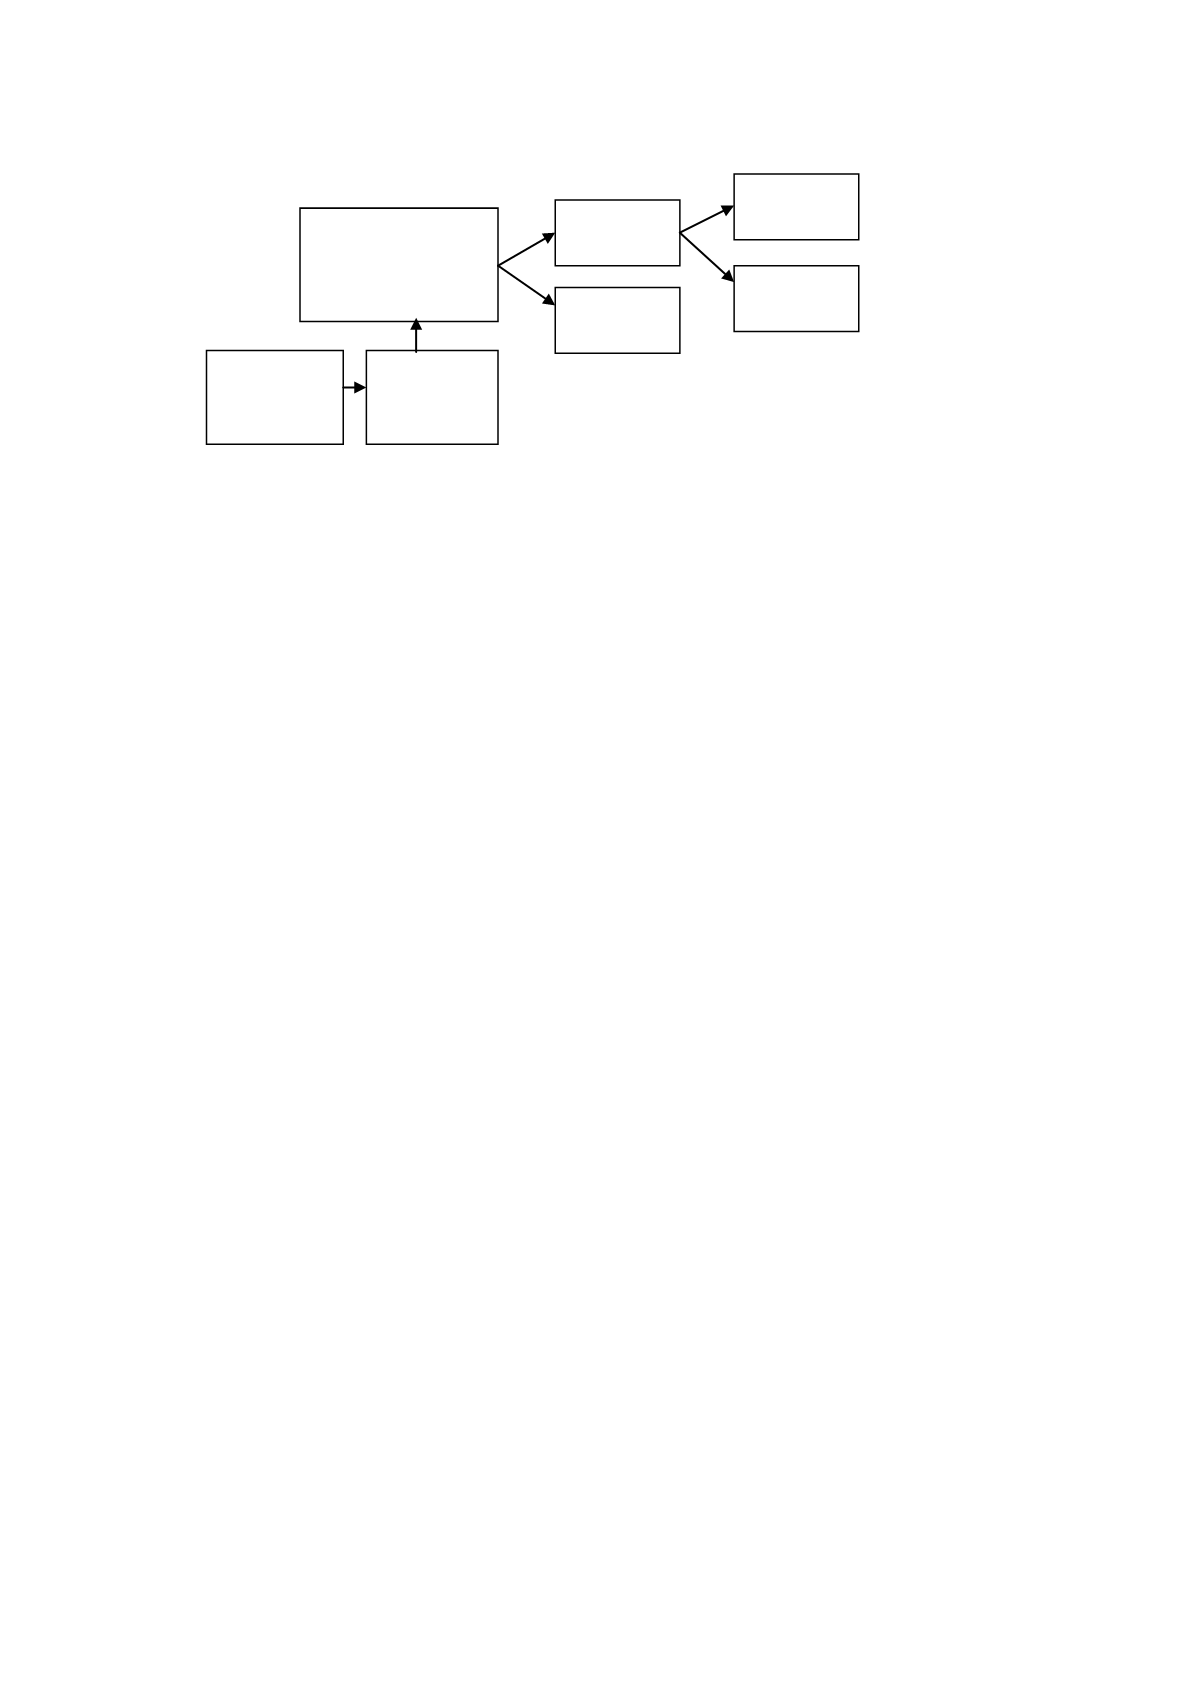
Figure 3.
The experiment. S-treated individuals born on an even day and A-treated
are individuals born on an even day and even month
Furthermore, among those given priority to Sassam (the S-treated), an additional
randomization was performed. Individuals born in an even month were given priority to
an AM (A-treated: 3,224 individuals), while the rest were set on hold for at least 45 days
(A-controls: 3,293 individuals). In sum, the experiment consists of two separate
experiments and three “randomly” assigned groups: (1) even day/even month, a
potentially early Sassam/early AM; (2) even day/odd month, a potentially early
Sassam/postponed AM; (3) odd day, a potential Sassam and AM are postponed. Figure 3
gives an illustration of the experiment.
The experiment design does not allow control over who receives intervention and
when. These decisions are made by the caseworker. However, the group classification
generates systematic differences in the availability and timing of the interventions
(Sassam and AM). The caseworkers were instructed to work as usual. That is, belonging
to a prioritized group or not, Sassam and AM were only performed when thought
necessary.
Note that if the initial screening made by the caseworkers is based on the individuals’
future sickness absence and dates of birth, the randomization will be distorted.
Individuals born on an even day could, for example, be screened out if caseworkers did
not want to make an intervention for this person. There are, however, two reasons why
we do not think this is a problem. Most often caseworkers screening is not the same as
caseworkers doing the assessment, and only the caseworkers selecting the treated (i.e.,
performing the randomization) were informed about the selection criterion. Secondly, and
more important, it was not mandatory for the caseworker to assess a person if
randomized to be treated (S-treated or A-treated).
All in all, we believe that making use of birth date as randomization devise is not a
problem. But since we have access to data on all individuals with sickness spells starting
in the period (see the inflow in Figure 3) when the experiment was conducted, we can
perform sensitivity analysis where we estimate intention to treat effects for the 87,136
individuals who had a possibility to be assessed in the period.
Assessment Experiment
population
(n=13,547)
Screening
5/11-14/12
(n=23,013)
Inflow
1/9-30/11
(n=87,136)
A-controls
(n=3,293)
A-treated
(n=3,224)
S-controls
(n=7,030)
S-treated
(n=6,517)


